(Ongoing study - updated 8th of May 2020)
Authors:
Eduardo Ponz Segrelles
Raúl Sánchez-Mateos Lizano
Abstract
Data Distribution Service (DDS) implementations in distributed systems are experiencing difficulties when starting up systems with a large number of communication entities. This often results in long periods of entities discovery in networks not prepared for these distributed computing systems, which leads to undesirably long set-up times before the application communication can take place. Such networks are mainly lossy networks, highly loaded networks, networks in which multicast communication is unavailable, or device communications networks using the 802.11 standard. This study aims to show the behavior of both discovery mechanisms, Client-Server Discovery Protocol (DS) and Simple Discovery Protocol (SDP), implemented in Fast RTPS, for variety of common test cases. SDP, based on the discovery of participants by joining multicast groups, and then moving to unicast participant-participant communication, is the default discovery protocol for DDS and therefore for Fast RTPS; while DS has been specifically developed by eProsima for Fast RTPS to address challenging scenarios for DDS such as those already mentioned. In this study, an in-depth analysis of these protocols is conducted based on factors such as the phase of the discovery paradigm and the network interface used by the devices hosting the participants. The results show faster discovery and better performance of SDP compared to DS in the testing environment, but with the drawback of excessive transmission of RTPS packets which may congest the network. It is concluded that SDP is the optimal protocol for use in regular networks or focused on systems that use DDS standard as communication layer, while DS is the optimal solution on lossy networks or networks without availability of multicast communication.
The content of the report is freely available, but publication (with source reference) may only take place in agreement with the authors.
Table of content
1 Introduction
2 Test Environment
2.1 Raspfarm components
2.2 Software versions
3 Test Cases
4 Methodology
4.1 Deployment
4.2 Test execution
4.3 Analysis
5 Experiments and results
5.1 Client-Server Discovery Protocol
5.2 Simple Discovery Protocol
5.3 Network traffic analysis
6 Conclusion
Bibliography
Appendix
1 Introduction
Fast RTPS, as a Data Distribution Service (DDS) middleware implementation, offers the feature of dynamically discovering communication entities within a network. The DDS standard divides this discovery process into two phases:
- Participant Discovery Phase (PDP): Discovery of remote communication entities (participants)
- Endpoint Discovery Phase (EDP): Discovery of communication endpoints (data writers and data readers).
The DDS standard defines a Simple Discovery Protocol (SDP) to accomplish such a task. In SDP, the PDP meta traffic is shared between the participants using well known multicast addresses and ports. While this method has the advantage of out-of-the-box participant discovery, it has the disadvantage of scalability, since the number of exchanged packets increases exponentially as new participants are added to the system. Furthermore, it requires multicasting capabilities, which may not be work reliably (such as for the case of WiFi communication[1]), or may not even be present at all.
For these reasons, Fast RTPS features a Server-Client discovery mechanism where one of the participants (the Discovery Server) gathers and distributes meta-traffic information for both PDP and EDP discovery phases, while the rest of the participants (Discovery Clients) only have to share their discovery metadata with the Server (instead of with all the remaining participants). This way, the number of PDP-related messages is limited to the number of participants involved. As for the EDP phase, the Clients send their data writers and data readers information to the Server, which redistributes them in bundles, thus reducing EDP network traffic (see Figure 1.1).
This article constitutes an assessment of the performance of both the Fast RTPS’ ServerClient discovery mechanism, and the Simple Discovery Protocol, on distributed scenarios where many parties using different network interfaces are involved. Its goal provide arguments to decided on the most optimal communication paradigm in such scenarios.

Figure 1.1: Discovery data-flow for Server-Client Discovery and SDP mechanisms
2 Testing environment
All the tests presented in this report have been conducted in a dedicated environment specially set-up for the purpose of performing the present as well as any other future Fast RTPS scalability studies. It consists of a cluster of Raspberry Pis (a.k.a. Raspfarm), with dedicated networking equipment in its own network.
2.1 Raspfarm components
The Raspfarm consists of the following components:
- 28 Raspberry Pi 4 Model B
- RAM: 4GB
- Storage: 64 GB micro-SD card
- OS: Raspbian GNU/Linux 10 (buster)
- 1 Asus RT-N12E Router
- 4 TP-LINK TL-SG108E V5 Switches 8 Ports Gigabit
- 4 Anker PowerPort 10 wall chargers


(a) Hardware setup (b) Hardware setup close-up
Figure 2.1: Raspfarm at eProsima. The RPis cluster consist of 4 racks, each with seven RPis 4B, a dedicated TP-LINK TL-SG108E V5 switch, and an Anker PowerPort 10 wall charger for full independence. Each switch is connected directly to the Asus RT-N12E.
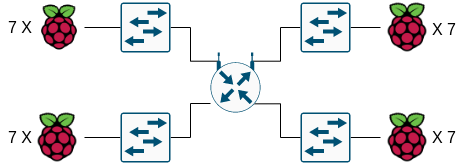
Figure 2.2: Raspfarm connection diagram
The Asus RT-N12E Router creates a network to which the test devices (henceforth Raspberry Pis, or simply RPis) are connected. Each RPi is connected via its Ethernet and WiFi network interfaces to this network.
For the wired connection, i.e. Ethernet communication, four switches are used which function as network bridge devices between the router and each of the RPis. A star network topology is implemented for the connection of the switches to the router, that is, each switch is directly connected to an ethernet port of the router, which is the network core device. The 28 RPis are evenly distributed among the switches, that is, 7 RPis connected to each switch (see Figure 2.1a and Figure 2.2).
The mixed standard 802.11 b/g/n with connectivity up to 300 Mbps is used for wireless communication, adapted to the connectivity limitations of the router.[2][3][4]
2.2 Software versions
The software version of the testing application, that of Fast RTPS, and that of their dependencies, are specified either as versions or specific commits:
- Fast CDR: v1.0.12
- Foonathan Memory Vendor: v0.5.0
- TinyXML2: ff61650517
- Fast RTPS: 54e4a62bee
- Discovery-Server: f45bde924b
3 Test cases
This article covers a total of 12 test cases, divided into several categories according to:
- The discovery paradigm.
- DS: Server-Client Discovery mechanism, also referred to as Discovery Server mechanism (DS).
- SDP: Simple Discovery Protocol [5]. This is the default discovery mechanism in Fast RTPS.
- The discovery phases involved. Two categories are defined:
- PDP: Only Participant Discovery Phase is involved, i.e. the participants do not have any data writers or data readers. The reason for having one category exclusively dedicated to PDP is to isolate the measuring of the Participant Discovery Phase without the interference of EDP meta traffic. Tests of this category deploy one Client participant per RPi. Moreover, one of the RPis also deploys a Server participant.
- EDP: Both Participant and Endpoint Discovery Phases are involved, i.e. the participants do have one or more data writers and/or data readers. Tests of this category deploy five publishers (data writers) and five subscribers (data readers) for each participant described in the PDP category.
- Network interfaces used for communication. Three categories are defined:
- WIFI: The communication is limited to the WiFi interface.
- ETH: The communication is limited to the wired Ethernet interface.
- BOTH: Half of the participants communicate using their WiFi, and the other half communicate using their wired Ethernet interface.
Each test-case name is built using the the corresponding acronyms of each category. As an example, test SDP_EDP_ETH deploys 28 participants, 140 publishers, and 140 subscribers, and measures participant discovery and endpoint discovery phases durations when the communication is limited to the ethernet interface. A compilation of all performed test cases is presented in Table (3.1)
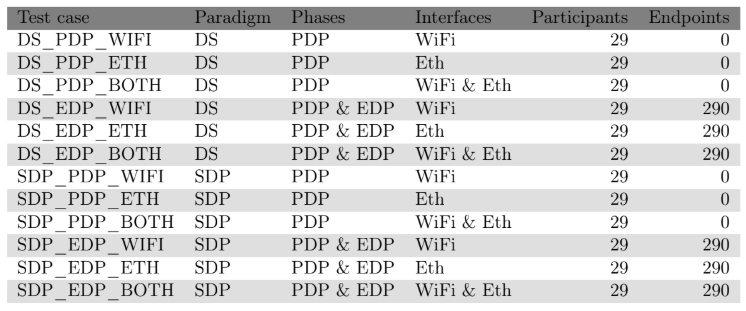
Table 3.1: Test cases
4 Methodology
The execution of discovery performance tests comprises three main stages: deployment, test execution, and analysis. This section presents the methods used to accomplish each of said stages.
4.1 Deployment
The deployment stage starts with the cross-compilation of the software components required for the execution of the tests, i.e. Fast RTPS library and its dependencies, and the testing application. For the conduction of these tests, eProsima’s Discovery-Serverapplication has been used as testing application.
After the cross-compilation is finished, the software, alongside configuration files to prepare the application for each specific test defined in Table (3.1) (in the form of XML profiles), are uploaded to the RPis using SSH connections.
4.2 Test execution
After the deployment stage, the testing application is run in each of the RPis simultaneously, loading the required XML profile defining the test case at hand.
Each testing application instance keeps track of the discovered participants, data readers, and data writers, recording the time when the last participant and endpoint were discovered (in the form of a UNIX timestamp with milliseconds precision). After what is considered a fair amount of time for the discovery to be completed (45 s in this case), the discovered participants, endpoints, and the time record are saved to a file, and the application shutsdown.
The simultaneous running of the test application is accomplished by launching all the instances from a central host over SSH. First, the central host divides time in blocks of 20 s. Then, it waits until the start of the immediate next block to open the SSH connections. The test application instances are instructed to commence at the start of the next block, performing an active wait to improve accuracy (see Figure 4.1). This method of synchronizing remote devices has been verified to yield a synchronized start with a tolerance of approximately 4 ms. All the RPis, as well as the host, are connected to the internet through the same access point, so their system times are as synchronized as this configuration allows.

Figure 4.1: Test synchronization diagram
When the test is completed, all the result files are downloaded into the host machine, which performs a validation of the results, meaning that it checks whether all participants, data readers, and data writers were discovered by every involved party. Furthermore, the level of synchronization is also verified.
For each test case, a total of 50 iterations are executed, so that a consistent analysis of discovery times can be performed.
4.3 Analysis
The methodology followed for the analysis of the results goes from the studying of the discovery times from a higher perspective through a comparison among the different tests, to a detailed study of the performance of each RPi. Thus, three types of analysis have been defined:
- Inter-test analysis
- Intra-test analysis
- Network traffic analysis
4.3.1 Inter-test analysis
A comparison between the results of the different tests cases. This analysis compares the performance of the discovery protocol according to the communication interface used by the RPis. Two types of statistical analysis are discussed for this case:
- Mean and standard deviation analysis.
Median and quantile analysis using the statistical Whiskers Boxplot tool. This alternative central-measurement study is performed because, as it can be seen in Chapter 5 Experiments and results, the discovery times distributions are far from normal. These discovery times are presented in the form of a Raincloud plot, which consists in a distribution curve and a Whisker box plot superimposed on a scatter plot showing every data point. The box plot shows a box featuring the first and third quartile (Q1 and Q3), as well as the median (Q2) of the data. The bounds of the whiskers are calculated as Q1−1.5∗ IQR and Q3+1.5∗ IQR, where the IQR (interquartile range) is defined as IQR = Q3− Q1. These whiskers bounds are a common way of setting a limit for statistical outliers.
4.3.2 Intra-test analysis
This is the performance analysis of the discovery mechanism for a specific test case. Various procedures are involved:
- Characterization of the probability distribution of the discovery times of participants and endpoints, in case the latter exist.
- Characterization of the behaviour of all RPis in each of the test execution iterations through an independent analysis of each iteration.
- Characterization of the behaviour of a specific RPi in all test execution iterations.
This is aimed at fault detection due to the malfunction of the testing device.
4.3.3 Network traffic analysis
The test related network traffic (RTPS packets) generated by each RPi in each of the phases (PDP and EDP) of each of the different test cases (DS/SDP - WIFI/ETH/BOTH) is accounted for and compared with and ideal scenario, where the number of packets are derived from the library’s algorithms. This analysis is performed to asses the level of packet loss and re-transmission due to different factors such as network congestion. For the purpose of capturing the network traffic, an instance of the tcpdump utility is launched on each of the RPi alongside the testing application instance.
5 Experiments and results
The analysis and discussion of the test results is divided according to the analyzed discovery mechanisms. First, the results obtained from the Client-Server discovery protocol (DS) tests are presented, starting with an inter-test analysis, which shows a comparison of the discovery time results for the various entities and communication means configurations. This is followed by an internal test analysis of one of the test cases as an example of how such results are interpreted (for all intra-test results see Appendix D Intra-test Results). Then, an inter-test analysis of the test cases comprising the Simple Discovery Protocol (SDP) is shown. Lastly, a comparison and discussion of the RTPS related network traffic generated during the experiments is shown.
5.1 Client-Server Discovery Protocol
This section details the results obtained from discovery experiments that implement the Server-Client Discovery Protocol (DS). An internal analysis of the DS_EDP_ETH test is also included, showing the behaviour of the server and clients during discovery.
5.1.1 Inter-test analysis
Figure 5.1a shows the mean values for the maximum participant discovery times (PDP), i.e. the mean value of the time in which the last participant has discovered all other participants. It is worth mentioning that in all tests 29 participants are deployed simultaneously, including the server participant.
These results highlight the fact that those tests in which the communication is divided equally between wired (RPis connected by Ethernet), and wireless (RPis connected by WiFi) communication, the participant discovery time is reduced.
In Figure 5.1b (a full scale version zoomed-in is given in Figure B.1), the distribution of the discovery times is presented in the form of a Raincloud plot. In the same figure (Figure 5.1b), it can be seen that most of the test cases present a binomial distribution (with some of them showing a right tale), where the points are gathered around two very limited time frames. This is caused by the server, which is distributing discovery information only every 450 ms. The latter is described in detail in Subsection 5.1.1 Inter-test analysis.
As for the Endpoint Discovery Phase (EDP), Figure 5.1c and Figure 5.1d show a very similar performance when limiting the communication to the wired interface and when splitting it between wired and wireless. However, as opposed to the PDP case, splitting the communication between the interfaces has a negative impact caused by the poor performance of the WiFi interface for the EDP case (as it can be seen in DS_EDP_WIFI).


a) PDP mean and standard deviation b) PDP median and quartiles


c) PDP + EDP mean and standard deviation d) PDP + EDP median and quartiles
Figure 5.1: Mean and median discovery time studies
This in turn is caused by the more acute network congestion that the EDP phase imposes, since the number of exchanged messages is significantly larger than that of the PDP phase. This network congestion has been verified to induce packet loss over WiFi to the point where some RPi did not receive any message from the Server for almost 12 s.
It should also be noted that the test scenario presented here relies on a single WiFi router. The use of multiple routers or access points could allow for a better exploitation of the channels in the 2.4GHz band.
5.1.2 Intra-test analysis
For a more in-depth study of each of the tests, an intra-test analysis is provided. In this analysis, the distributions of the discovery times of participants and endpoints are identified, the evolution of these times for each of the iterations are measured, and the operation of the RPis in each iteration is shown, for each specific test. As an example of such outcomes, the results obtained for test case DS_EDP_ETH are presented below. The figures resulting from the data processing of the remaining DS test cases can be seen in Appendix D Intra-test Results.
5.1.2.1 Intra-test analysis of DS_EDP_ETH test case
First, the distributions of the discovery times for each phase of the discovery process, PDP and EDP, are shown in Figure 5.2. Figure 5.2a shows the distribution of discovery times of all participants during the PDP phase, while Figure 5.2b represents the distribution of discovery times of all endpoints, data readers and writers, during the EDP phase.


a) Participants discovery distribution b) Endpoints discovery distribution
Figure 5.2: Distributions of discovery times

Figure 5.3: Expanded endpoints discovery times distribution
In the second figure it can be seen that the endpoints are discovered in four different intervals of 500 ms each. This is due to the mechanism of collecting packets with endpoint data on the Server, as introduced in the previous section. The mechanism of endpoint data distribution by the Server participant consists in gathering these packets over a period of 450 ms. After this period of time, the Server sends the collected endpoint data to all participants. This can be seen in more detail in Figure 5.3, in which four endpoint discovery intervals with a time spacing of 500 ms are shown. This increase of the discovery intervals (with respect to the 450 ms period) is due to the added processing of the packets by the Client participants.
To check the correct operation of the test in various executions, as well as for fault detection and potential error sources isolation, Figure 5.4 is provided. It shows that the isolated occurrence of the endpoint discovery times of Figure 5.3, in a time interval of 3.65 seconds, occurs in iteration number 21.
This iteration can be examined in Figure 5.5 so that the RPis causing the outlier can be identified. In this case RPi 5 is identified as the cause of the EDP delay, so it is analyzed in Figure 5.6. This figure shows the operation of this RPi in each of the iterations of the test. From these results, it can be concluded that the RPi operates correctly for all test runs.

Figure 5.4: Discovery times for each iteration of the test execution


Figure 5.5: Discovery times of each RPi involved in the test Figure 5.6: Discovery times of RPi number 5 in all test run iterations
It is worth mentioning the increase in the discovery time of data readers and data writers in the EDP, compared to the discovery of participants in the PDP. The reason for this is that the number of RTPS entities to be discovered by each participant is multiplied by 10, since each participant implements 5 data readers and 5 data writers. Furthermore, this results in a significant increase in packet traffic and a potential network congestion. This will be explained in more detail Section 5.3 Network traffic analysis.
5.2 Simple Discovery Protocol
This section describes the results obtained from the execution of the tests that implement the simple discovery paradigm. As in Section 5.1 Client-Server Discovery Protocol, a comparison of the results of the various test cases is made. The method for performing the internal analysis of the SDP test cases in similar to that of DS (see Subsection 5.1.2 Intra-test analysis), so that an in-depth analysis of them is not presented. However, the figures resulting from the data processing of the SDP test cases can be seen in Appendix D Intra-test Results.


(a) PDP mean and standard deviation (b) PDP median and quartiles


(c) PDP + EDP mean and standard deviation (d) PDP + EDP median and quartiles
Figure 5.7: Mean and median discovery time studies for the SDP
5.2.1 Inter-test analysis
As introduced in Subsection 4.3.1 Inter-test analysis, the inter-test analysis is split into the study of two statistical tools, a study focusing on means and standard deviation, and a study focusing on medians and quartiles, including maximum and minimum outliers. For each approach, the analysis is divided such that each discovery phase, PDP and EDP, can be addressed separately, and afterwards compared.
Figure 5.7 shows all the graphs that serve as performance comparisons between tests. On the left, Figure 5.7a and Figure 5.7c show the analysis of means together with the values of the standard deviation; while on the right, Figure 5.7b and Figure 5.7d present the study of means and quartiles. An enlarged image of the latter can be seen in Appendix B Raincloud Plots (Figure B.3 and Figure B.4), while their corresponding values are presented in the Appendix C Median and Quartiles Analysis Tables (Table (C.3) and Table (C.4)).
The most remarkable behavior from the figures mentioned above is that of the tests in which only the WiFi network interface is used. In these, the high variation of discovery times for both discovery phases is observed, which is due to the high number of outliers. The opposite occurs in tests with wired communication, in which the discovery time is short, both in the PDP phase and in the EDP phase, with a low IQR value. This highlights the somehow poor scalability of multicast communication over WiFi (for the case of PDP).
5.3 Network traffic analysis
This section presents an analysis of the packets exchanged by participants in the various discovery mechanisms. It is based on the comparison of the number of packets required in each of the discovery paradigms, i.e. in the Simple Discovery Protocol and in the ClientServer Discovery Protocol, for WiFi and Ethernet network interfaces. Thus, the impact of each of these discovery paradigms on the network load is visualized.
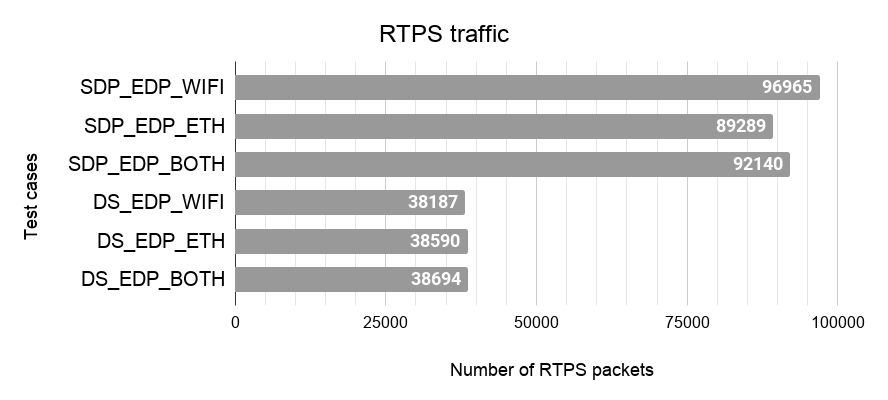
Figure 5.8: Total number of RPTS packets exchanged in each discovery test case.
Figure 5.8 shows the total number of RTPS packets exchanged by all participants during the entire discovery mechanism, for each of the test cases. From this figure, it is clear that the number of RTPS packets sent during the discovery process is significantly higher for SDP. This is partially due to the fact that in this protocol, each time a participant is discovered, an announcement is sent to all known participants (twice is some cases). Furthermore, the communication between the participants in the EDP phase is unicast, that is, each participant must communicate with the rest directly, thus increasing the number of connections needed. However, in the case of DS, the client participants have a single unicast communication with the server participant (for both PDP and EDP phases), which acts as the central point of communications, receiving, collecting and distributing the discovery information.
To characterize the RTPS packets, and to define the origin and purpose of each one, the analysis of these packets is divided according to the discovery phase to which they belong. Thus, a distinction is made between packets intended for the discovery of participants (PDP), and packets intended for the discovery of the participant’s data readers and writers (EDP). This is shown in Figure 5.9.
From Figure 5.9a, several points are worth mentioning. For SDP, it can be seen how the number of measured packets from the experiments is between the theoretical maximum and minimum calculated. The reason is that the reliability of the SDP participants is best effort, i.e. no re-transmission of lost data packets is required. In case the discovery packets are lost and the participants are not discovered, they wait until the next periodic announcement sent to be discovered. However, the opposite applies to DS, where participants implement reliable data readers/writers, which means that in case of loss of discovery participant data packets, their re-transmission is requested. Moreover, it is observed that in DS experiments, the number of packets measured in the experiments is lower than the established minimum and maximum. This is caused by the loss of reliability related packets on the Writer Liveliness Protocol (WLP)[6]. Since in these experiments WLP endpoints do not exchange data (because the entities lease duration is set to infinity), the loss of these packets does not entail any re-transmission, thus reducing the packet traffic. It is also noteworthy that the difference in the number of packets sent by a participant is mostly attributable to the PDP. This is because the server groups the data of the participants it knows and forwards it to each of these participants, which translates into a significant reduction of network traffic.


(a) PDP traffic flow (b) EDP traffic flow
Figure 5.9: Measured and theoretical traffic flow during the PDP and EDP based on the discovery paradigm and the network interface. The figure shows the comparison between the number of packets exchanged in the test runs (bar plot) and the theoretical calculation of the number of packets for an ideal case without packet loss and re-transmission (yellow and red lines).
Figure 5.9b shows the number of RTPS packets exchanged during the EDP phase. In this case, the data readers/writers reliability is reliable, i.e. the packets are acknowledge on reception, and in case of packet loss, re-transmission is requested. Therefore, there are cases in which the number of measured packets is higher than the theoretical maximum.
Because of all the previous, it is concluded that the SDP produces network congestion in those cases where a high number of participants are involved in the communication. This leads to a higher packet loss and therefore to a reduction of the overall performance. The protocol implementation is open to optimizations, such as eliminating the duplicate announcements when new participants are discovered (which could lead to a PDP traffic reduction of around 28%), or limiting the announcement reply to a discovered participant to just that new participant (which could cut another 25% of the traffic in the testing scenarios).
Client-Server Discovery Protocol on the other hand presents a more scalable solution in terms of network traffic, which can lead to a better performance if the server has enough processing power to cope with its workload increase when compare to a SDP participant.
Furthermore, Client-Server protocol offers a more stable discovery paradigm for lossy networks, since both PDP and EDP phases reliability is reliable, as oppose to SDP where the PDP phase is best effort. Lastly, Client-Server Discovery Protocol offers a discovery mechanism alternative for those networks where multicast communications is not possible, thus expanding the DDS standard capabilities.
6 Conclusion
Fast RTPS features two different discovery mechanism: the Simple Discovery Protocol (SDP), and Client-Server Protocol (DS). The former is based on the discovery of participants by joining to multicast groups; to later discover the data reader/writers each participant comprises through a unicast communication with the other participants. In opposition to this, each client in the DS protocol knows the IP address and port of a centralized server that handles the detection of the other clients involved using unicast reliable communications with each of them.
Both these mechanism have been tested in a dedicated testing environment, measuring the discovery times of each of them when the communication is established via different means, namely wired (Ethernet), wireless (IEEE 802.11 b/g/n), and a combination of both.
It can be concluded that SDP performs better than DS in most of the test cases, but with the limitation of using multicast communication for the discovery of the other participants. However, the SDP shows a higher volume of RTPS packet exchange when compared to DS, which could cause a degradation of communications in those networks with limited resources. The SDP network traffic is intended to be optimized in future versions of Fast RTPS, with special emphasis on the PDP phase, where is is believed that as much as 28% of the traffic can be optimized.
The tests executed over the WiFi interface have shown a significant decrease in performance when compared to those executed over the Ethernet, caused by packet loss due to network congestion. This causes a blackout in some RPis that can last, in the testing scenario, up to 9 and 12 seconds, for SDP and DS respectively.
Bibliography
[1] Charles E. Perkins, Mike McBride, Dorothy Stanley, Warren "Ace" Kumari, and JuanCarlos Zúñiga. Multicast Considerations over IEEE 802 Wireless Media. InternetDraft draft-ietf-mboned-ieee802-mcast-problems-11, Internet Engineering Task Force, December 2019. Work in Progress.
[2] IEEE Standard for Information Technology - Telecommunications and information exchange between systems - Local and Metropolitan networks - Specific requirements - Part 11: Wireless LAN Medium Access Control (MAC) and Physical Layer (PHY) specifications: Higher Speed Physical Layer (PHY) Extension in the 2.4 GHz band. IEEE Std 802.11b-1999, pages 1–96, 2000.
[3] ISO/IEC/IEEE 8802-11:2005/AMD4 [IEEE Std 802.11g-2003] Information technology– Local and metropolitan area networks– Part 11: Wireless LAN Medium Access Control (Mac) and Physical Layer (PHY) Specifications–Amendment 4: Further Higher Data Rate Extension in the 2.4 GHz Band. ISO/IEC 8802-11:2005/Amd.4:2006(E) IEEE Std 802.11g-2003 (Amendment to IEEE Std 802.111999), pages 1–83, 2006.
[4] IEEE Standard for Information technology– Local and metropolitan area networks– Specific requirements– Part 11: Wireless LAN Medium Access Control (MAC) and Physical Layer (PHY) Specifications Amendment 5: Enhancements for Higher Throughput. IEEE Std 802.11n-2009 (Amendment to IEEE Std 802.11-2007 as amended by IEEE Std 802.11k-2008, IEEE Std 802.11r-2008, IEEE Std 802.11y2008, and IEEE Std 802.11w-2009), pages 1–565, 2009.
[5] The Real-time Publish-Subscribe Protocol (RTPS) DDS Interoperability Wire Protocol Specification. Version 2.2. Section 8.5 Discovery Module. Standard, Object Management Group, September 2014.
[6] The Real-time Publish-Subscribe Protocol (RTPS) DDS Interoperability Wire Protocol Specification. Version 2.2. Section 8.4.13 Writer Liveliness Protocol. Standard, Object Management Group, September 2014.
Appendix
The appendix can be found in the complete document, available in pdf format here.
Fast RTPS Discovery Mechanisms Analysis - PDF
More information about the eProsima Fast RTPS Server-Client Discovery Analysis:
For any questions please contact