

Professional DDS observability
See the system. Understand the data. Resolve problems faster.
A professional workspace for monitoring, diagnosing and interacting with complex DDS systems, live or from a recording. Built for Fast DDS Pro and Safe DDS deployments.
Investigate running systems and MCAP or SQLite recordings.
Domains, Discovery Servers and XML profiles in one workspace.
Product development, support and DDS expertise together.
Designed for production systems in robotics, automotive, industrial, defense and safety-critical programs.
Built for


Two-minute product tour
See the complete DDS engineering workflow.
Discover how DDS Monitor Pro helps engineering teams understand complex DDS systems, investigate their data and interact with them—live or from a recording.
Explore domains, entities, connections and application data in one workspace.
Inspect topics, QoS, statistics, charts, images and recorded evidence.
Register types, publish controlled samples and validate system responses.
Professional observability workspace
Move from “something is wrong” to evidence.
Follow the architecture, inspect the traffic, reproduce the behavior and validate the fix without assembling a disconnected toolchain.
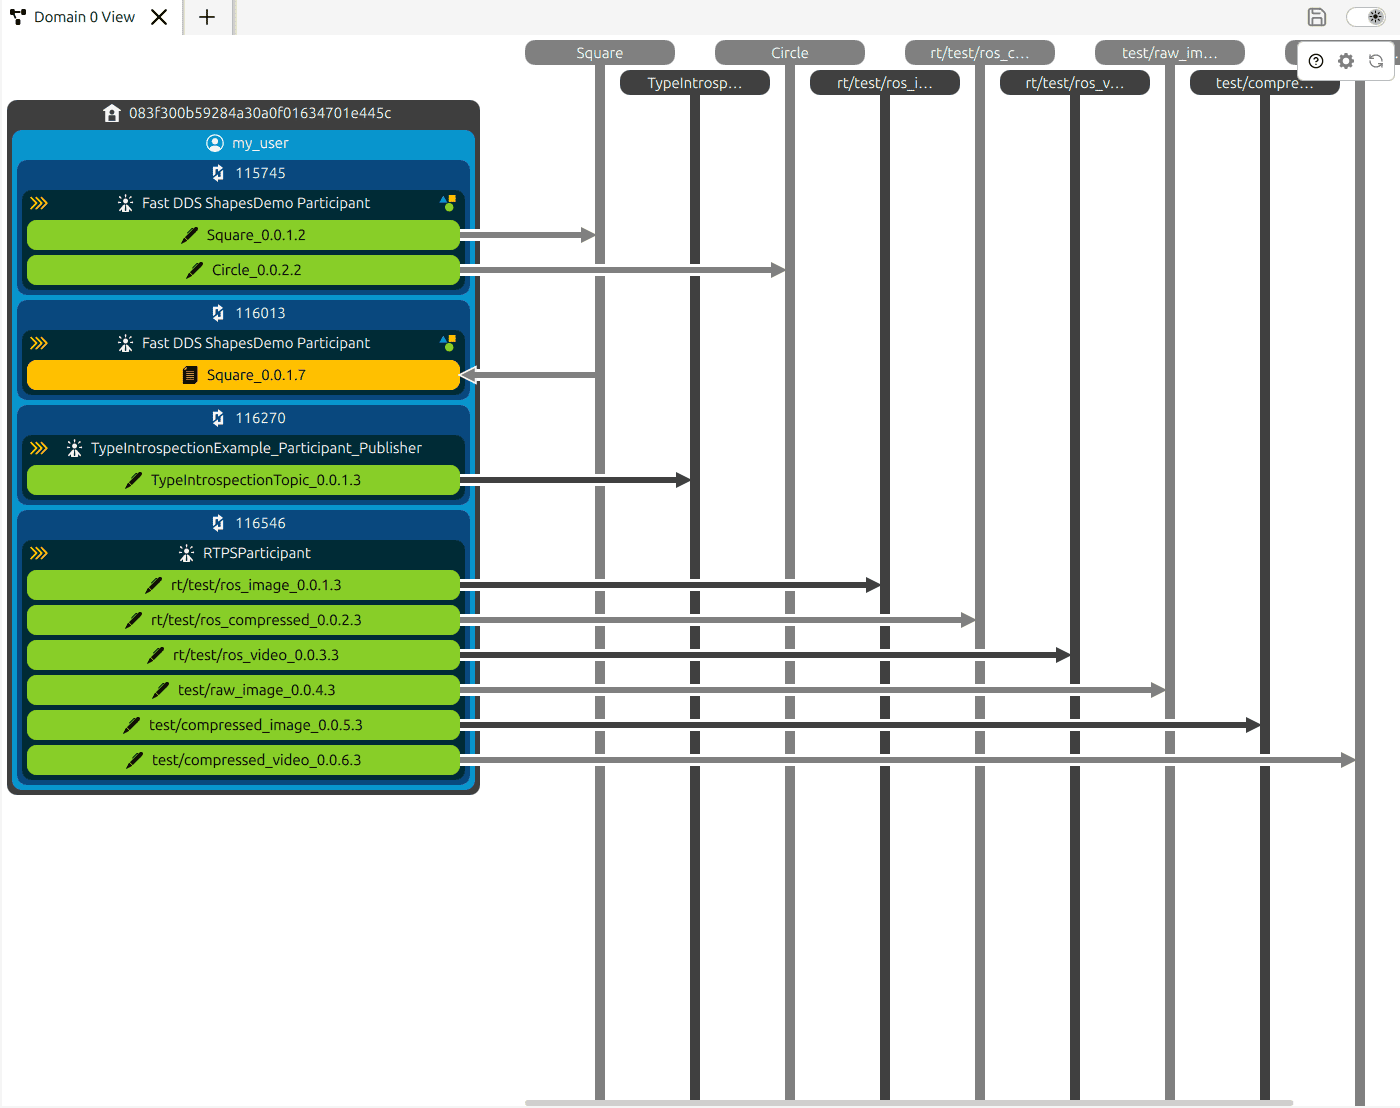
See the complete DDS system as it runs.
Monitor multiple domains, Discovery Servers and XML-defined environments in one dockable workspace. Move from the domain graph to entity details, statistics and raw topic data without losing context.
- Multiple monitors side by side
- Dockable and splittable panes
- Domain, physical and logical views
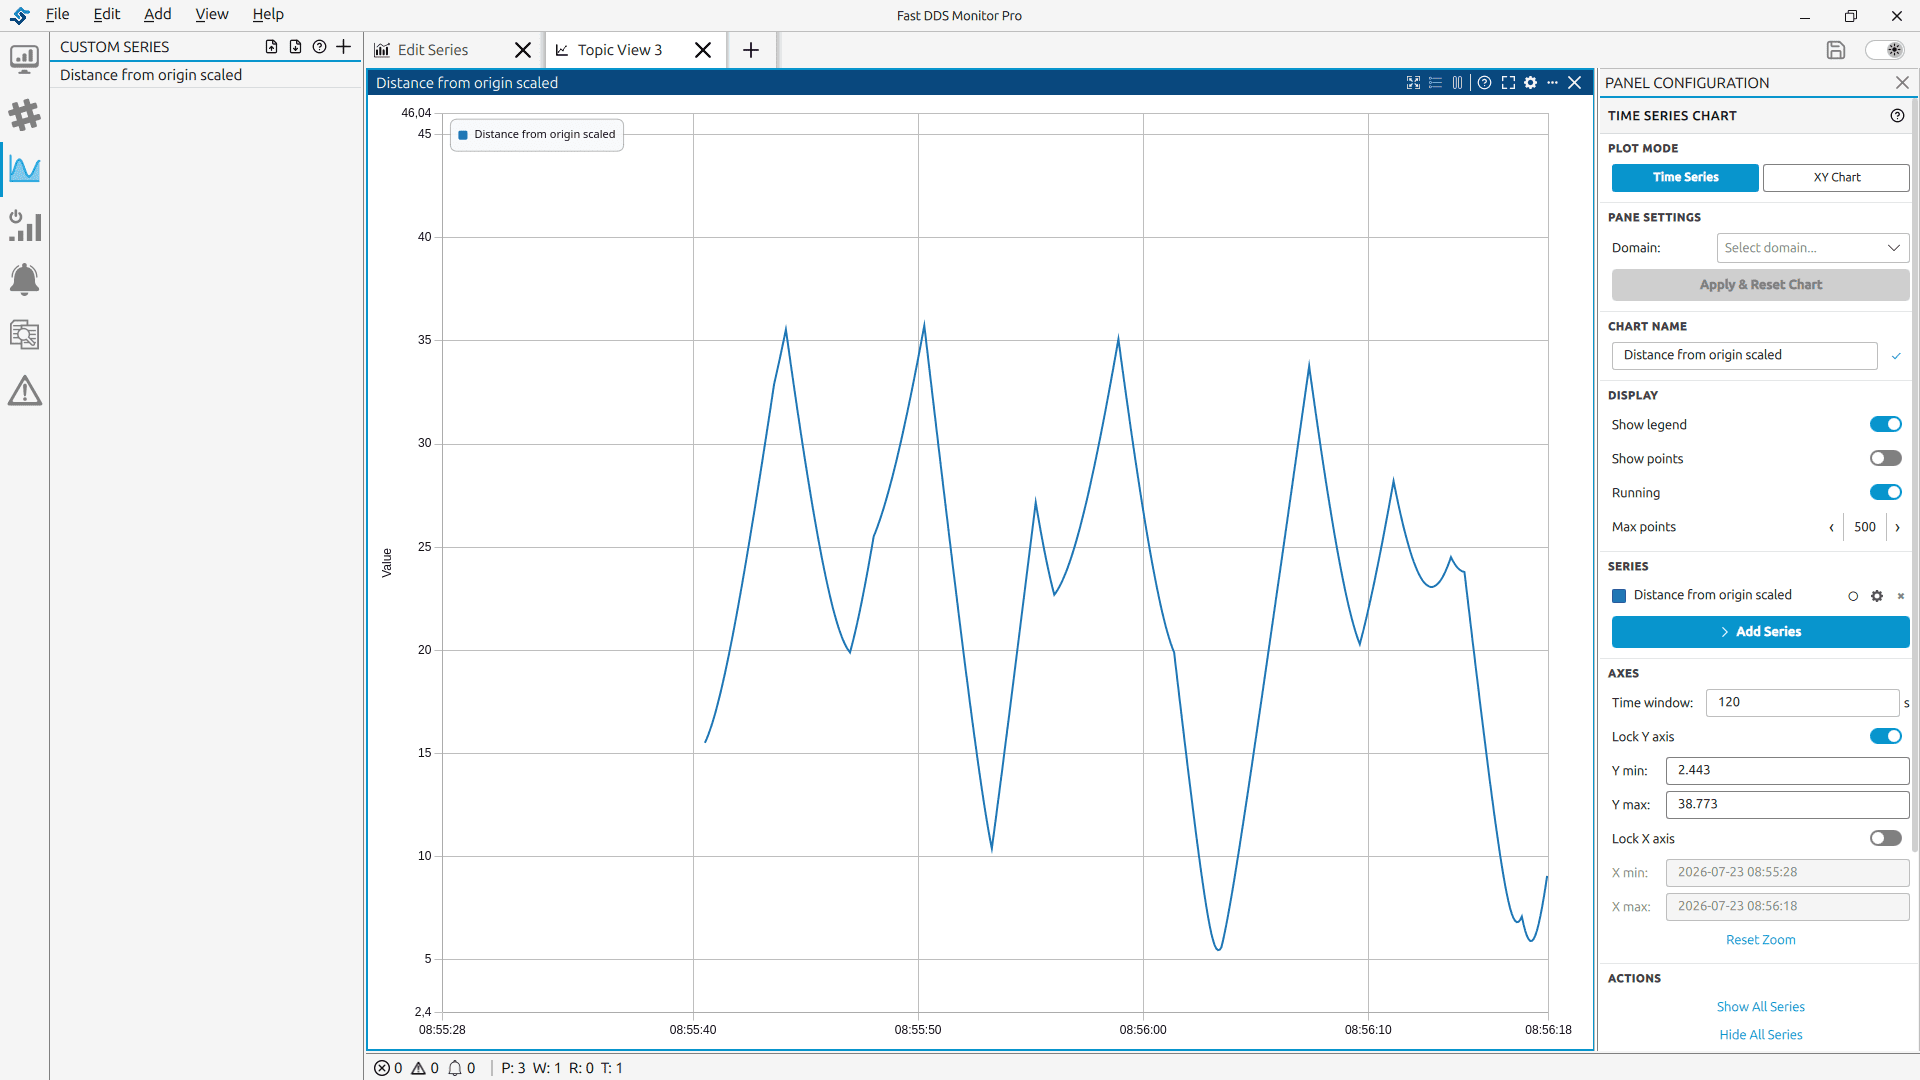
Turn live topic fields into useful engineering signals.
Plot numeric topic values as time-series or XY charts, inspect samples, register missing IDL types and define custom series with JavaScript formulas.
- Time-series and XY charts
- Custom calculated series
- Spy, IDL and register-type workflows
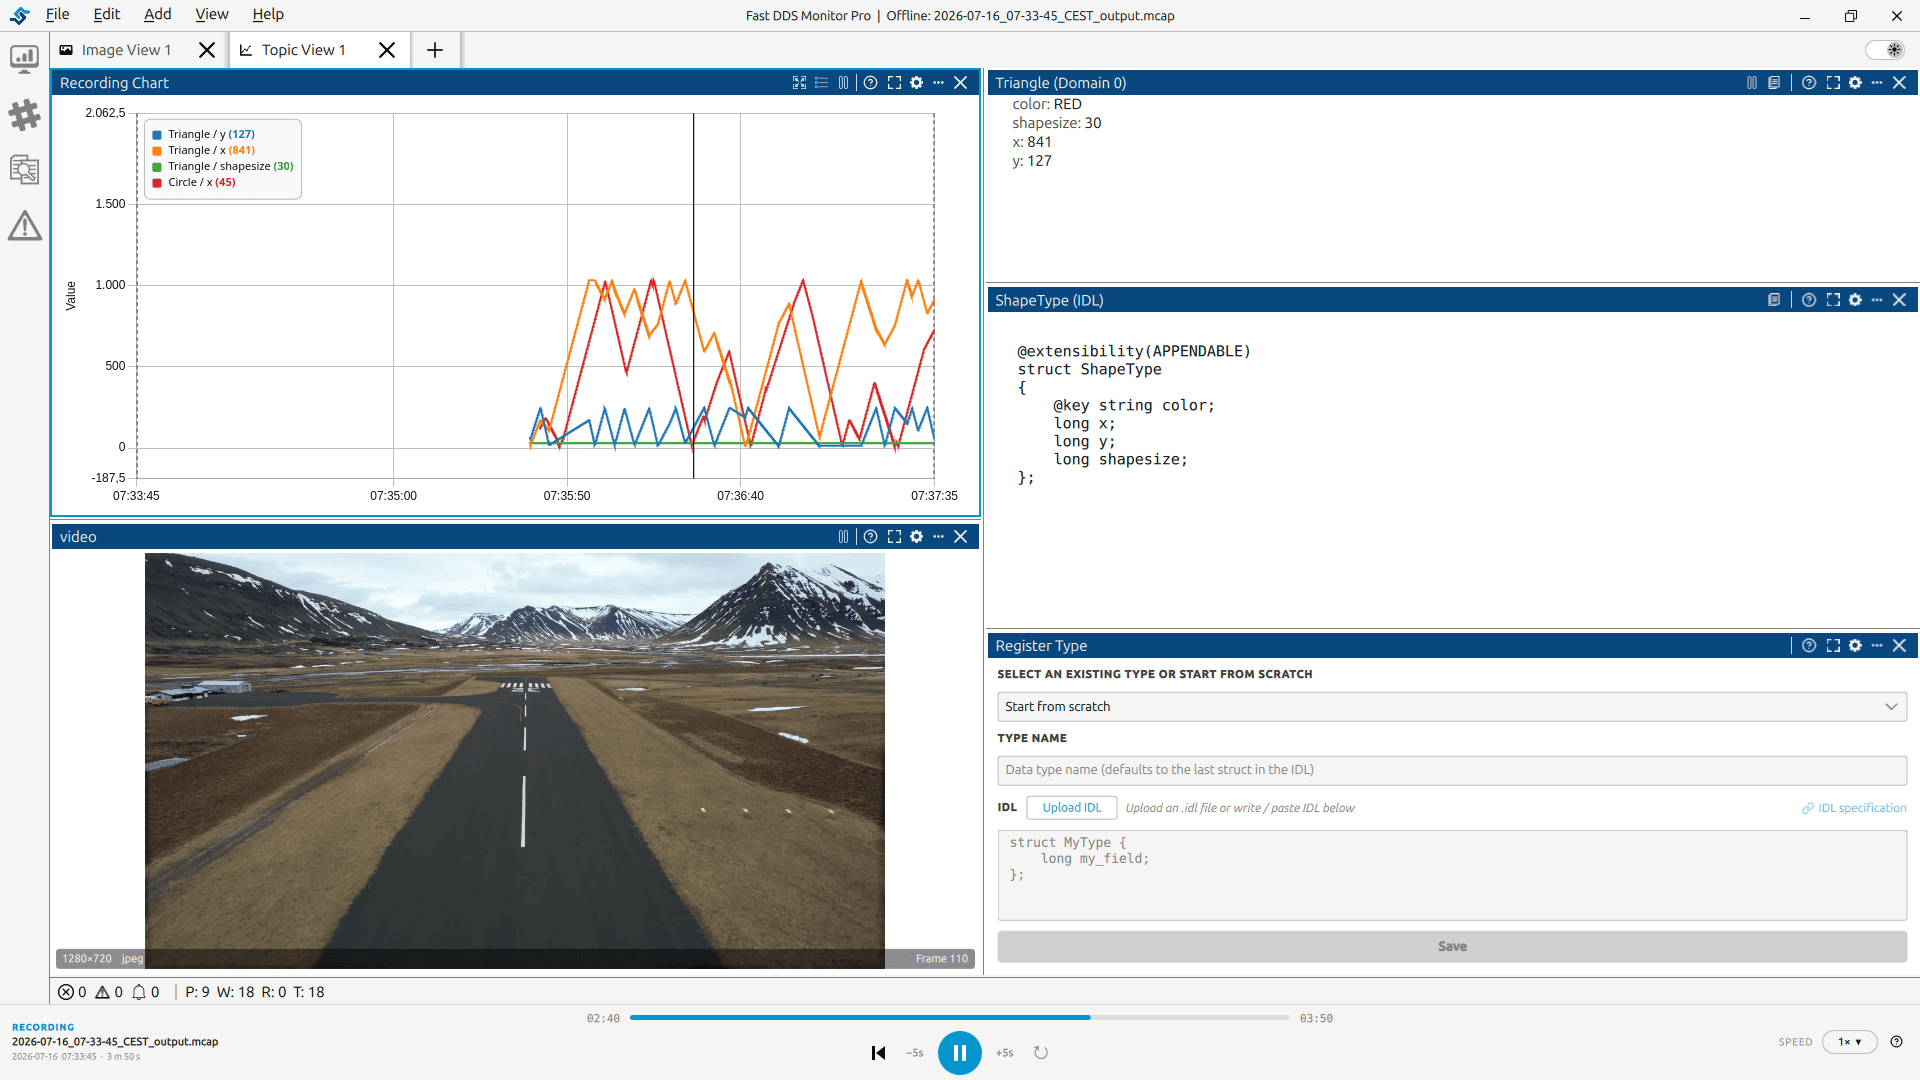
Investigate recorded behavior with the full workspace.
Open MCAP or SQLite recordings and explore them with synchronized playback. Scrub, pause, loop and change speed while charts, images and topic views stay aligned to the same timeline.
- MCAP and SQLite recordings
- Playback speed and timeline control
- Charts, images and topic data in context
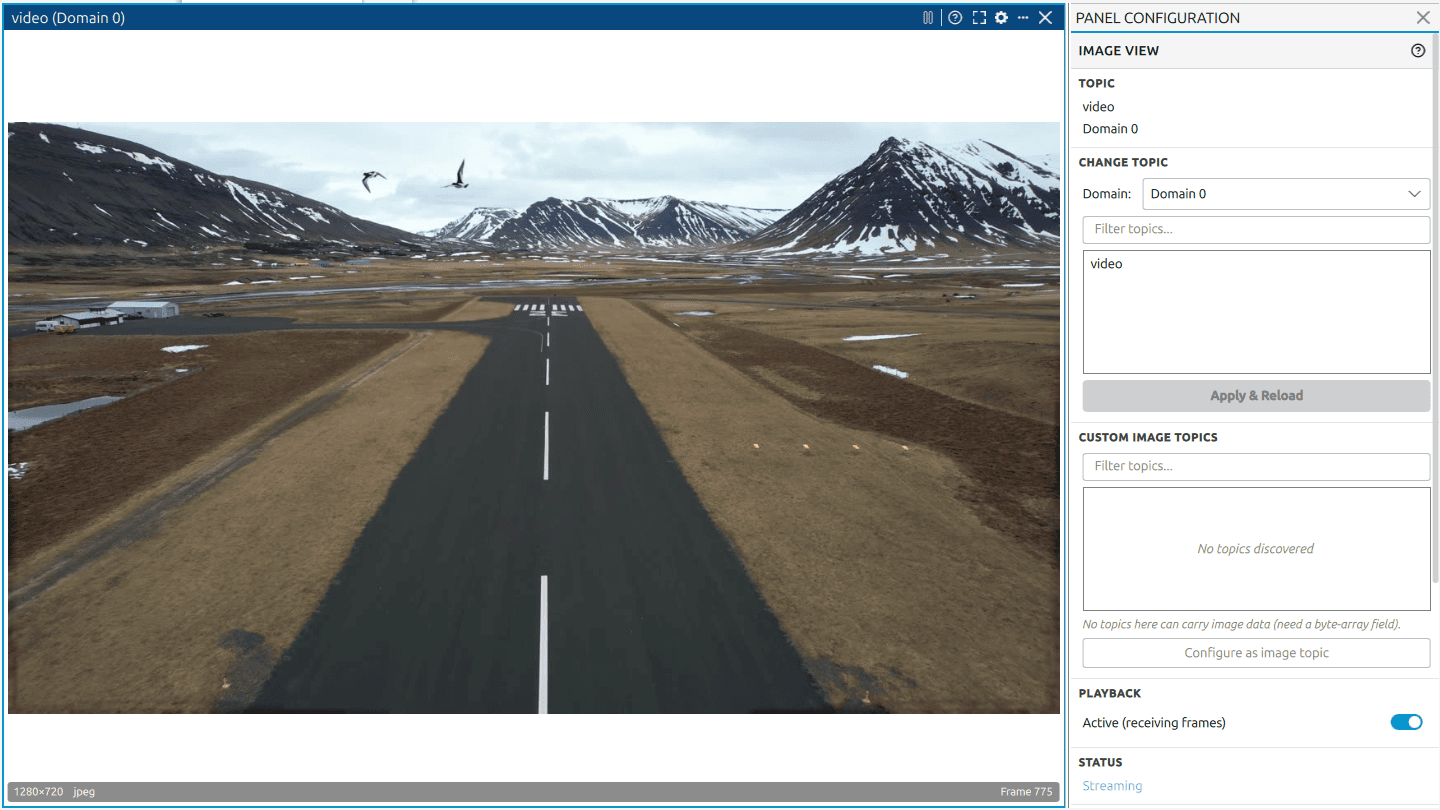
Bring image and video topics into the diagnostic workspace.
Render live image data next to statistics, topic charts and entity information. Correlate what happened in the data space with what happened in the physical system.
- Live image and video panes
- ROS 2 image compatibility
- Configurable multi-pane layouts
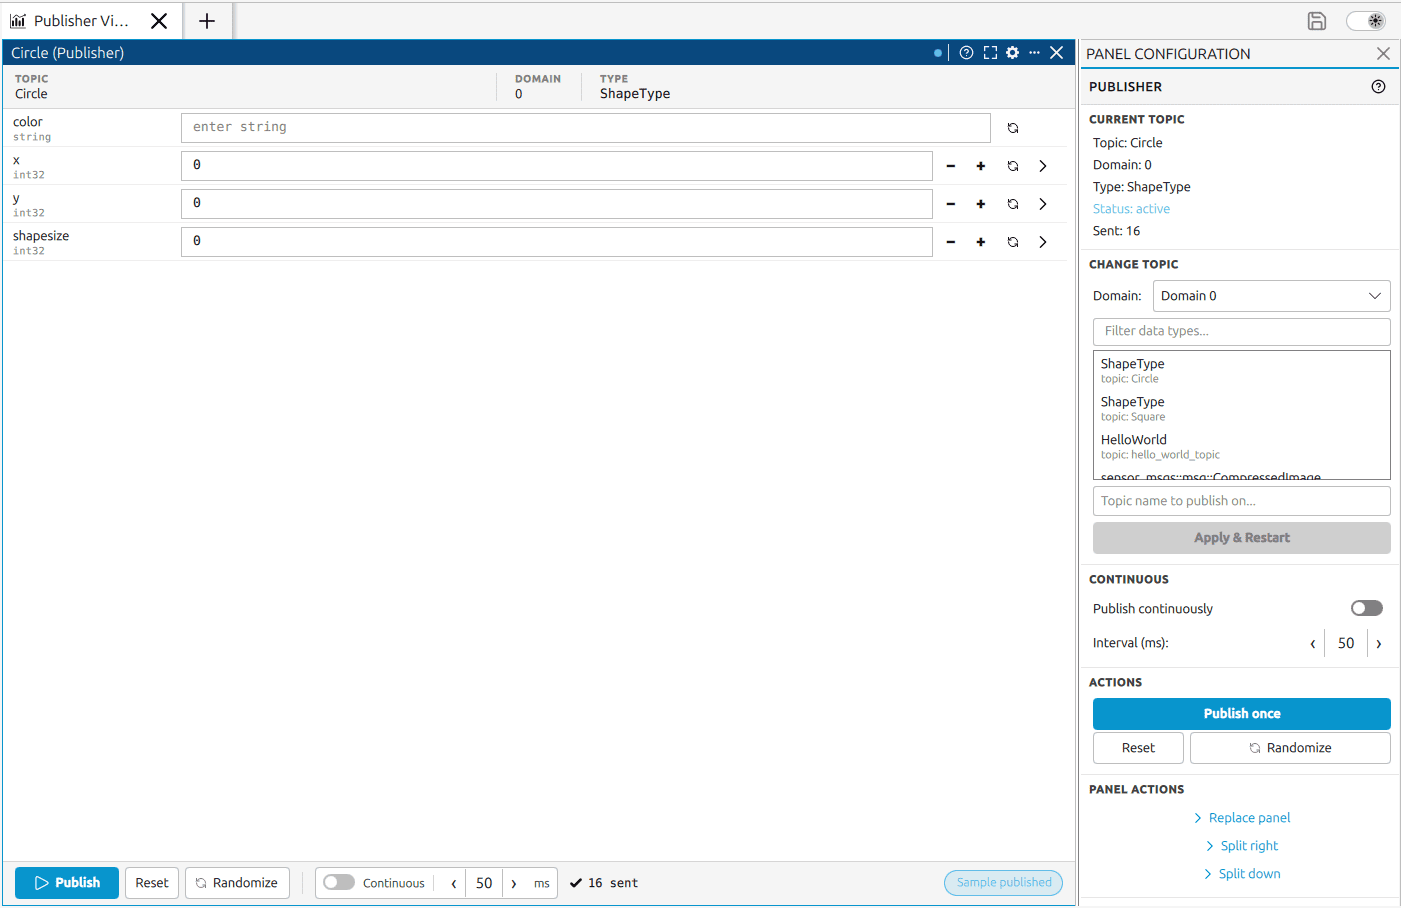
Inspect a topic, then publish a controlled test sample.
Generate a publishing form directly from the discovered data type and send one-shot or continuous samples without leaving the monitor.
- Dynamic forms from topic types
- One-shot or continuous publishing
- Register user-supplied IDL
See the diagnostic workflow
Short, concrete stories. Not a generic product tour.
Use focused videos to show how DDS Monitor Pro helps an engineer recognize a problem, understand its cause and verify the solution.
01 · QoS diagnosis
Find and resolve a compatibility mismatch.
Turn an invisible publisher/subscriber incompatibility into an actionable configuration fix.
02 · Reliability
Connect communication behavior to the robot.
Watch the physical result, inspect the DDS data and correct the reliability policy in one story.
03 · Topic visualization
See application behavior in an XY chart.
Plot topic fields against each other and make data relationships immediately visible.
Built around the DDS engineering loop
Observe. Diagnose. Test. Preserve the workspace.
Save layouts, chart configuration, alerts and tab order so a useful diagnostic environment becomes repeatable across sessions and team members.
Connect
Domains, Discovery Servers, XML profiles or recorded datasets.
Explore
Entities, topology, statistics, topics, IDL, images and alerts.
Interrogate
Build charts, custom series and controlled publishing tests
Continue
Save and restore the complete professional workspace.
DDS Monitor or DDS Monitor Pro?
The open-source monitor starts the journey. Pro becomes part of the engineering workflow.
DDS Monitor remains available as an open-source tool. DDS Monitor Pro adds the workspace, visualization, offline analysis, maintenance and direct support expected in professional programs.
Capability | Commercial DDS Monitor Pro | Open source DDS Monitor |
|---|---|---|
Deployment focus | Production and professional programs | Development, prototyping and research |
Active environments | Multiple domains, servers and profiles | One environment at a time |
Workspace | Dockable, splittable and restorable | Fixed layout |
Topic visualization | Time-series, XY, images and custom series | Statistics charts |
Offline analysis | MCAP and SQLite playback | - |
Support and maintenance | Direct engineering support and LTS | Open-source resources |
Architecture first
Bring professional DDS observability into your workflow.
Tell us what you need to observe, reproduce or validate. Our team will help you assess DDS Monitor Pro for your Fast DDS Pro or Safe DDS architecture.
Product and architecture fit.
Deployment and data-source requirements.
Licensing, maintenance and support options.
Looking for the open-source DDS Monitor?
Use the GPL-3.0 edition for development, evaluation and research.
View it on GitHub ↗